The Jersey City real estate market in 2026 is confusing for one reason: published home prices contradict each other. One source reports a median near $665,000, another near $720,000, and a local brokerage snapshot pushes past $800,000.
The short answer: defensible closed-sale medians run roughly $700,000 to $760,000, modeled home values sit near $653,000 to $665,000, and the market is broadly balanced and leaning seller-favorable in core submarkets. Prices are slightly soft citywide (down about 1.1% to 1.4% year over year) but up 4% to 5.7% within property segments. That gap is a mix-shift effect, not a real decline.
Rather than adding another median to the pile, Patrick Southern of Properties by Southern explains why the figures diverge and what they mean for your decision. Patrick approaches Jersey City property as a pricing, positioning, and revenue question, drawing on experience across selling, investing, and new development. The goal is interpretation, not a statistics dump.
The Real Jersey City Median Price in 2026 and Why Sources Disagree
Ask what the median Jersey City home price is in 2026 and you get a range, not an answer. None of the numbers is wrong. They measure different things.
A modeled index estimates value across all housing stock and smooths outliers. A closed-sale median reflects only what actually sold in a window. A list price is what sellers hope for. Single-month snapshots swing with the seasonal mix of what closed.
Patrick's working range for 2026 is roughly $700,000 to $760,000 for closed sales, with modeled values near $653,000 to $665,000. When you see any Jersey City price, ask which category it belongs to before trusting it.
How Can the Median Fall While Values Rise? The Mix-Shift Effect
A falling median does not mean homes are getting cheaper. This is the mix-shift effect: when a higher share of smaller, lower-priced units sells in a period, the median drops even as each property's value rises.
Downtown condos prove it. One 2026 analysis found the trailing three-month median down nearly 12% year over year to about $822,000, while median price per square foot rose roughly 4% to around $900 (Jessica Williams Real Estate Blog). The median fell because the mix of sold units shifted toward smaller apartments. Per-square-foot value, the cleaner measure, went up.
For buyers, a lower headline median is not a signal to wait for a broader decline. For sellers, a soft citywide median does not describe what your specific unit is worth. Patrick reads per-square-foot trends alongside the median to separate genuine price movement from a change in what happened to sell.
Are Jersey City Prices Rising or Falling in 2026?
Both things are true at once: citywide medians are slightly soft, and prices within property types are rising. The gap is the mix-shift effect again.
Citywide aggregate: down about 1.1% to 1.4% year over year (Zillow, Redfin)
Condos and townhomes: up 5.7% to $724,000 (NJ Property Value Pro)
Single-family homes: up 4.0% to $725,000
Amortio model: up 4.9% overall (Amortio)
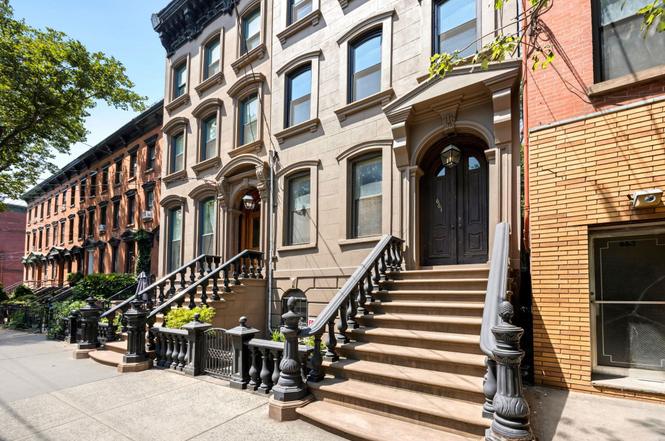
Jersey City is not one uniform market. Condos, single-family homes, brownstones and townhouses, and multifamily properties behave as separate submarkets with their own demand and pricing dynamics. A waterfront condo, a Heights two-family, and a Bergen-Lafayette townhouse are not competing for the same buyer. Patrick's guidance: ignore the single citywide number and look at the trend for your specific property type. That is the figure that tells you whether your home or target purchase is appreciating.
Is 2026 a Buyer's or Seller's Market in Jersey City?
Jersey City in 2026 is broadly balanced, leaning seller-favorable in core submarkets, and the balance shifts with the season. Months of supply moved from about 3.1 months in March (Amortio) to roughly 4.4 months in early 2026 (Houzeo), consistent with normal spring listing surges. Below six months traditionally favors sellers.
The more revealing figure is the sale-to-list distribution. Zillow reports a median sale-to-list ratio around 98.7%, with 23.6% of sales closing above list and 62.7% below. That is a bimodal market. Roughly a quarter of homes attract competition and sell above asking; most sell at a modest discount.
What separates the two groups is not luck. It is condition, positioning, and pricing. Well-prepared, correctly priced listings in strong locations draw multiple offers. Overpriced or condition-challenged properties sit and eventually discount. This is Patrick's core territory: positioning a specific property so it lands in the competitive group rather than the discount group.
How Fast Are Homes Selling in Jersey City in 2026?
Days-on-market figures range from 17 to 68 days across sources, and the confusion is entirely about what each number measures. There are three distinct metrics:
List-to-contract: 36-42 days. Zillow shows 36 days to pending; Realtor.com shows 42 days to accepted offer, down about 7% year over year.
List-to-close: 60-70 days. Financing and closing add roughly a month; Prodigy reports 68 days.
Peak-season, well-positioned: 17-25 days. In busy months, quality listings contract fast.
Budget 36 to 42 days to a signed contract and 60 to 70 days to close. The critical insight is what the DOM gap reveals. Prodigy notes the spread between the 39-day listing median and the 68-day closed median is driven largely by properties that started overpriced and needed cuts. A long time on market usually signals a pricing or condition problem, which is exactly where Patrick's pre-market judgment changes the outcome.
Jersey City Home Prices by Neighborhood in 2026
Jersey City prices vary roughly threefold by neighborhood, which is why a single citywide median misleads. Price per square foot is the cleanest comparison.
Sources: Prodigy Q1 2026, Realtor.com, Redfin.
Locate your target area on this map before anchoring any price expectation. Patrick interprets these figures through submarket knowledge, since a rising or falling number means something different in each neighborhood. Journal Square appreciation reflects new-supply repricing; Bergen-Lafayette reflects buyers pricing out of costlier areas.
What Does It Actually Cost to Own in Jersey City Right Now?
Affordability in 2026 is shaped by rates in the high-6% range. As of August 7, 2026, Bankrate shows New Jersey 30-year fixed rates around 6.55%, with Freddie Mac's national weekly average at 6.66%. Several regional forecasts expect rates drifting toward 5.8% to 6.0% by year-end (DeFalco Realty).
Purchase price is only part of the picture. Property taxes, condo HOA fees, and insurance materially inflate the true monthly cost.
That short-term gap (a 2025 Construction Coverage study) explains why some qualified renters wait. Over a longer horizon, rent inflation and eventual mortgage payoff tend to favor owners. Patrick frames affordability as a total carrying-cost decision over your likely holding period, not a sticker price.
Are There First-Time Buyer Assistance Programs in Jersey City?
Two substantial programs help qualified first-time buyers close the affordability gap.
Sources: NJHMFA; City of Jersey City GNHP.
What Is the Outlook for the Jersey City Housing Market for the Rest of 2026?
The outlook is modest, sustainable, and supply-aware, not a boom or a crash. Houzeo projects 2% to 4% appreciation with inventory growth of 5% to 10% and no crash, and Redfin has flagged Northern New Jersey, including Jersey City, among the nation's hottest 2026 markets. Demand fundamentals are durable: the population reached about 302,824 in 2024, and a high-income finance and tech workforce supports price levels.
The differentiator is supply. Jersey City has over 37,000 units planned and more than 9,000 under construction (Jersey Digs). Named projects include the 800-unit Harborside 4 (roughly 200 condos, construction started early 2026) and the completed twin 64-story towers at One Journal Square adding 1,723 units.
Patrick's new-development lens matters here: a project's unit mix, absorption pace, and price-per-square-foot positioning reshape the resale market around it. Indicators worth watching:
Months of supply (rising into fall is seasonal, not a warning)
Sale-to-list ratio
Mortgage rate movement toward the 5.8-6.0% forecast
Pace of new deliveries on the waterfront and in Journal Square
What This Means If You're Buying, Selling, or Investing
The reconciled data points to different moves for each group.
Sellers: Do not price to 2022–2023 comps. Overpricing is the single biggest mistake, and the DOM data shows overpriced listings sit, then discount. Patrick's seller work begins before listing: a condition walkthrough, targeted repairs, guidance on paint, flooring, lighting, decluttering and staging, and an ROI review so you avoid spending that does not return. Pricing and positioning are then built around your specific property and competing inventory.
Investors: Think in yields and cap rates, not headline prices. Condo yields are thin (roughly 4-5% gross), while stabilized multifamily cap rates run near 5.6% to 6.0% (ApartmentLoanStore; Berkadia). The large rental pipeline pressures near-term rents.
Frequently Asked Questions
What is the median home price in Jersey City in 2026?
Closed-sale medians cluster between about $700,000 and $760,000 depending on source and month, while modeled home values sit near $653,000 to $665,000. The right figure depends on which measure you're reading.
Why do Zillow and Redfin show different Jersey City prices?
They measure different things. Zillow's ~$665K is a modeled index across all housing stock; Redfin's ~$720K is a closed-sale median on a rolling three-month window. Neither is wrong.
Will Jersey City home prices drop or crash in 2026?
No crash is forecast. Consensus points to 2-4% appreciation, and the soft citywide median reflects a mix-shift toward smaller units, not falling values.
Which Jersey City neighborhood is most affordable?
Greenville, at roughly $364 per square foot, connected by light rail rather than PATH.
Is it cheaper to rent or buy in Jersey City in 2026?
Renting is cheaper month-to-month by about $1,280 (median $4,377 to own vs. $3,097 to rent). Owning typically wins over a 7–10 year horizon.
Should I wait for rates to drop before buying?
Rates sit near 6.55% and may drift toward 5.8–6.0% by year-end, but the decision hinges on your holding period, not the exact month you buy.
The Bottom Line for 2026
Once you separate modeled indices from closed sales and list prices, the real range comes into focus: roughly $700,000 to $760,000 for closed sales, with values holding or rising within each property type even as the citywide median softens. The market is broadly balanced, homes sell in predictable timeframes when priced correctly, and prices vary threefold across neighborhoods.
The figures matter less than what they mean for your specific property, submarket, and timeline. That interpretation, across selling, investing, and new development, is where Patrick Southern of Properties by Southern adds value. If you're weighing a move in 2026, the next step is a conversation grounded in your actual numbers, not the headlines.


