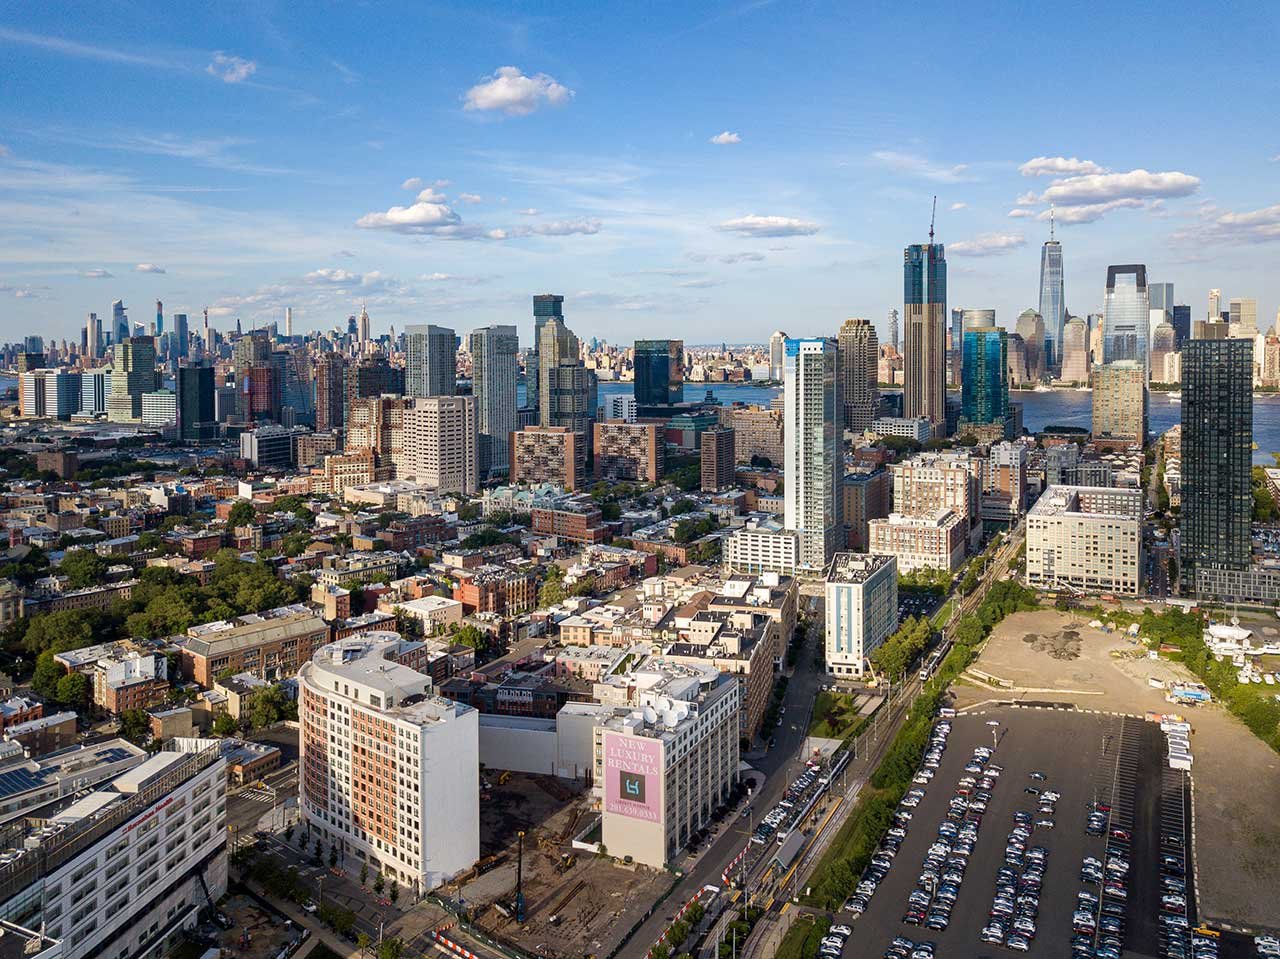
Jersey City real estate is a good investment for appreciation and long-term growth, not day-one cash flow. Prices rose roughly 9% annually over the past decade, but current cap rates of 5.6% to 6.0% against roughly 6% financing produce thin initial cash-on-cash returns. The right deal depends on strategy, neighborhood, and property type, not citywide averages.
This assessment comes from Patrick Southern, a Jersey City property owner and active investor with more than two decades in the market and firsthand experience across residential sales, landlords, developers, investment buyers, and portfolio dispositions. This article evaluates Jersey City rather than promotes it. It separates cash flow, appreciation, value-add, and exit potential, and uses cited data, not adjectives.
One rule organizes everything below: averages mislead; you underwrite the specific property. Neighborhood, building, layout, and future competitive supply can each flip a deal from strong to weak. Below, we run the real numbers, walk the underwriting, explain PILOT abatements, and compare Jersey City honestly against its alternatives.
Is Jersey City a Cash-Flow Play or an Appreciation Play?
For most investors today, this is an appreciation market. The historical record is strong. According to NeighborhoodScout, Jersey City home prices appreciated 136.28% over the last 10 years, roughly 8.98% annually, and 51.95% over five years. The Federal Reserve Bank of St. Louis corroborates the trend, with the Hudson County house price index at 339.73 in 2024, a 3.4x nominal increase since 2000.
The demand behind that growth is structural, not speculative. Population climbed from 247,597 in 2010 to 292,449 in 2020, an 18.1% jump, with Census estimates near 302,822 in 2024. The Regional Plan Association found household formation outpacing development, which keeps upward pressure on both prices and rents.
So who is this market for?
Right fit: Long-horizon investors who can absorb thin initial cash flow in exchange for appreciation and rent growth.
Poor fit: Investors who need strong day-one cash yield to justify the purchase.
What Prices and Rents Really Look Like
Jersey City median prices range from roughly $645K to $750K, and that spread reflects methodology, not chaos. Each source measures something different, so pick the one that matches your underwriting.
For underwriting, trust closed-transaction data for your specific property type and neighborhood. Advertised rent also differs from achievable rent:
Newer, amenitized units command the top of the range; older stock rents for less.
What Investors Are Actually Paying: Real Cap Rates
Skip hypothetical yields and look at what buyers actually paid. Transaction-based Jersey City cap rates cluster between 5.6% and 6.0%.
Going-in and projected cap rates diverge sharply. Value-add or assumable-debt deals price lower: Marcus & Millichap sold a 15-unit property for $2.3M at a 4.5% in-place cap rate because the buyer underwrote growth and inherited cheap debt. That gap between current and stabilized yield is exactly where value-add investors earn their return.
What does a sub-6% cap rate signal? Strong professional conviction. The ULI/PwC Emerging Trends survey named Jersey City the top apartment-investment prospect for 2024, with a 61% buy recommendation, ahead of Brooklyn's 53%.
Running the Numbers on a Realistic Jersey City Property
Here's the underwriting math in three steps:
NOI = gross rent minus all operating expenses (before debt service)
Cap rate = NOI divided by purchase price
Cash-on-cash = annual pre-tax cash flow after debt divided by cash invested
Now apply it to a $700,000 condo. The fixed carrying costs stack up before any mortgage:
Those fixed costs consume much of the achievable rent. This is why a 6.5% cap-rate deal produces sub-5% cash-on-cash today: RentalCalcs data shows that with 25% down and 6% debt, a 6.5% cap deal yields roughly 4.8% cash-on-cash. When financing sits near cap rates, leverage barely helps day one.
Patrick's discipline: stress-test every deal at zero appreciation. If it loses money on that basis, rent can't realistically grow, and taxes or HOA are climbing toward a reversion, it's a weak investment, reputation of the neighborhood notwithstanding.
How PILOT Abatements Reshape a Property's Economics
Jersey City's most distinctive, and most overlooked, investment variable is the PILOT (Payment In Lieu Of Taxes) agreement. It can swing a building's tax burden dramatically.
Under New Jersey's Long-Term Tax Exemption Law, PILOTs run up to 30 years from completion. Per the NJ Division of Community Affairs, payments typically equal 10% to 15% of annual gross revenue, far below the standard 1.85% to 2.23% effective rate on market value. For new development, that lifts early NOI and makes deals pencil that otherwise wouldn't.
The risk is the PILOT cliff. As Jersey City Property Taxes Explained details, when a PILOT expires the property reverts to full conventional taxation, a large step-up that erodes returns for owners who hold through it without sufficient rent growth.
Two practical rules:
Remaining term drives price. PILOTs transfer to new owners, so a short remaining term means the cliff is closer than the seller may imply.
Compliance now matters more. In 2026, Genova Burns reports Jersey City issued an Executive Order on PILOT audits, tightening reporting and profit-limitation enforcement.
Buying an abated building near expiration without modeling the reversion is a common, expensive mistake.
Matching Neighborhood and Property Type to Your Strategy
Jersey City is not one market, it's several. RealtyTrac data shows price per square foot ranging from $1,419 in the 07310 Waterfront to $885 in Downtown's 07302 to $320 on the West Side's 07304. Your strategy should dictate where and what you buy.
Condo HOA fees run $400 to $800 monthly in mid-market elevator buildings and $800 to $1,500 or more in luxury waterfront complexes, so review each building's budget and reserves before you model anything. Multifamily, largely 1960s vintage per Berkadia's data, remains the classic vehicle where renovation genuinely creates value.
Patrick's core point: match entry price, property type, and neighborhood to your goal. Buy a waterfront condo expecting cash flow and you've bought the wrong asset.
Where the Real Risks Are, and Where They Aren't
The single most important risk insight is vacancy bifurcation. Not all Jersey City vacancy is equal, and the headline "supply glut" narrative gets over-applied.
Stabilized older stock: 2.8% vacancy. PwC/CBRE data shows this holding tight even after a 20% inventory increase over five years, with same-store rents up 2.4%.
New Class A: 10.7% vacancy. Prodigy Real Estate reports Northern NJ Class A running high as units lease up.
Supply is the real near-term headwind. Commercial Observer reports nearly 18,000 pipeline apartments, with new Class A competition called "fierce." Rates compound it: Freddie Mac data cited by ROI-NJ shows roughly 6.06% in mid-January 2026.
But this is moderation, not a crash. Statewide inventory sits near a two-month supply, supporting prices. On rent control, Jersey City launched a citywide audit in early 2026, so confirm whether a target property is covered. For rental execution and tenant placement, Jose Ramos is the specialist to consult.
How Jersey City Stacks Up Against Hoboken, Brooklyn and Manhattan
Jersey City's investment case rests on one number: rents sit only $712 below NYC despite dramatically lower prices. That gap is the entire thesis.
Sources: 6sqft, Berkadia via Commercial Observer.
A $1M buyer gets roughly three times the space in Jersey City that Brooklyn offers. And because rents track NYC far more closely than prices do, each dollar invested buys disproportionately more income. External validation reinforces the case: over 75,000 New Yorkers moved to New Jersey in 2024, up 12%, with Jersey City a primary destination. That migration feeds both rental and buyer demand from below.
Frequently Asked Questions
What is a good cap rate for Jersey City real estate?
Transaction-based cap rates run 5.6% to 6.0% for stabilized multifamily. Value-add deals can price lower (4.5%) when buyers underwrite growth or inherit cheap debt.
Can you make positive cash flow on Jersey City rental property?
Rarely day one at current prices and rates, and that's the honest answer. The paths that work:
Multifamily (1960s vintage) with value-add upside
Emerging West Side neighborhoods with lower entry
Larger down payments to reduce debt service
Is it too late to invest in Jersey City?
No, but the easy money is done. This is a selective, disciplined-buyer market, moderation, not a crash. Structural demand (75,000+ NYC migrants in 2024) still supports long-term appreciation.
Should I buy a PILOT-abated property?
It depends on the remaining term. Abatements boost early NOI, but always model the reversion to full taxation. Buying near expiration without that math is a costly error.
What are the biggest risks?
New Class A supply (10.7% lease-up vacancy)
Roughly 6% financing compressing cash flow
PILOT cliff and rent-control exposure
The Bottom Line
Key takeaways:
Jersey City is an appreciation market (~9%/year over a decade), not a day-one cash-flow market.
Current cap rates (5.6% to 6.0%) near roughly 6% financing mean thin initial cash-on-cash.
Averages mislead. The range of $320 to $1,419 per square foot across zips changes everything.
PILOT terms, HOA, and vacancy bifurcation (2.8% vs 10.7%) can flip a deal.
Rents sit only $712 below NYC despite far lower prices, the core value case.
The decision comes down to disciplined underwriting on the specific property, not citywide averages. Some Jersey City deals are genuinely weak investments, and an honest assessment says so. Patrick Southern's role is to pressure-test those variables through owner-investor experience and tell you, plainly, whether a specific property supports your return.


